Master Data Visualization: Top 10 Essential Charts
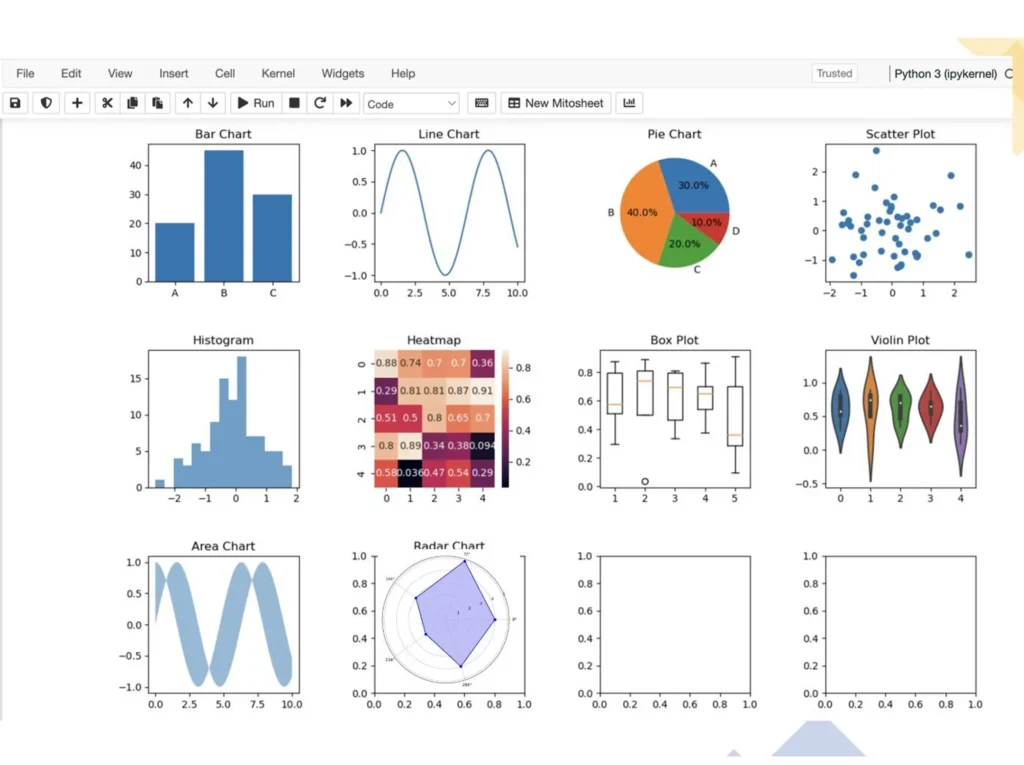
📚📚 Improve your Data Analysis and Visualization skills. Learn about these essential top 10 type of charts 🔹Bar Chart:A Bar Chart is commonly used to compare categorical data across different groups. It uses rectangular bars to represent the data’s magnitude and is perfect for visualizing data distributions, frequencies, and comparisons.Usage: Compare sales figures of different […]
RAG: Lessons Learned from a Year of Experimentation
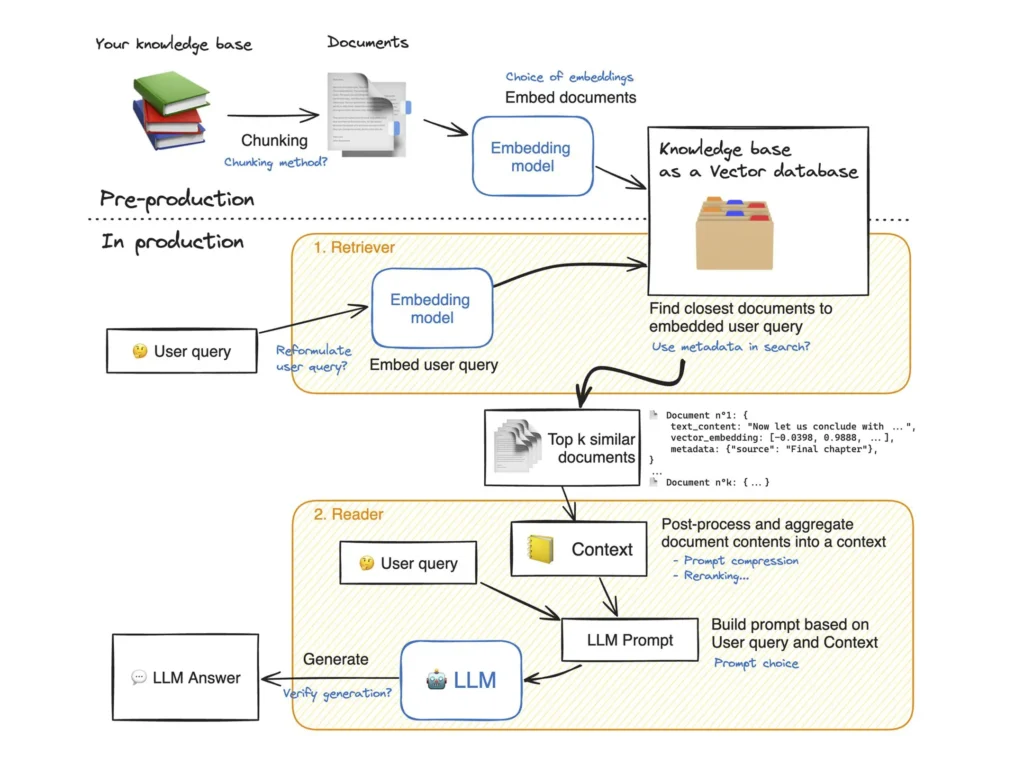
💡 After working for almost an year on 𝗥𝗔𝗚 (𝗥𝗲𝘁𝗿𝗶𝗲𝘃𝗮𝗹 𝗔𝘂𝗴𝗺𝗲𝗻𝘁𝗲𝗱 𝗚𝗲𝗻𝗲𝗿𝗮𝘁𝗶𝗼𝗻), here are my thoughts: 1️⃣ Like any ML problem, you will never get good results the first time you try. It’s an iterative process. 2️⃣ A whole lot depends on your chunking strategies. This determines whether your ‘chunk’ has piece of information you […]